Falling & Rising Wedge
You may wonder why is it that we have the falling and rising wedge in a separate section. The reason is simple, these patterns can be either reversal or continuation patterns. Depending on where the pattern was formed and its slope it could signal a continuation of the trend or a trend reversal.
Let’s see each one of them.
Continuation Rising Wedge
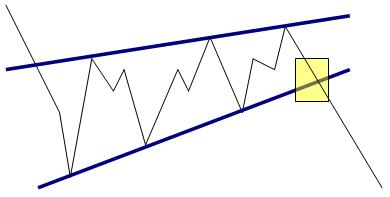
As all wedges, this one begins wide and contracts as the market reaches new highs:
[Image 3]
Continuation rising wedges are a bearish continuation pattern. It starts out wide, but narrows as prices keep going up. The highs and the lows of the pattern form a falling wedge. Two or more touched points are required to form the converging trendlines. This pattern is completed when the price breaks through the support trendline.
What makes this wedge a continuation pattern?
The slope of the wedge is against the previous trend.
Continuation Rising Wedge in Action
[Chart 6]
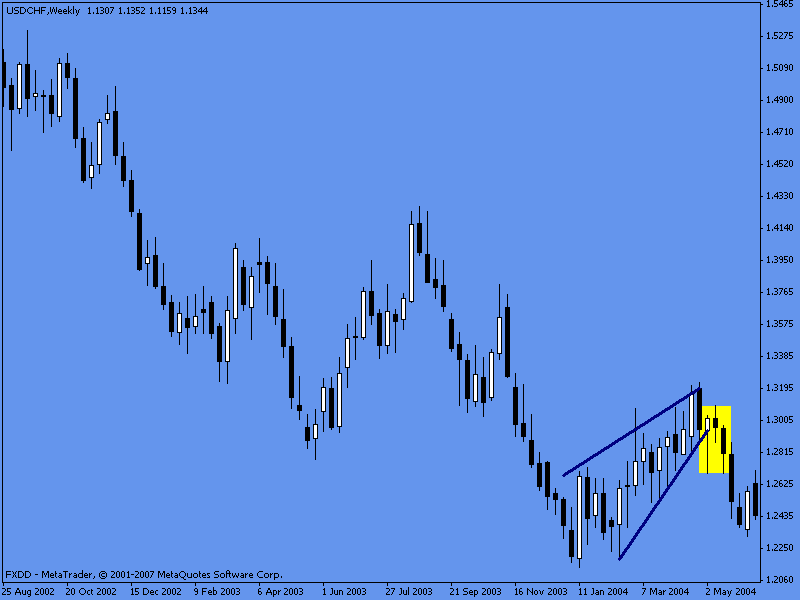
This rising wedge is a continuation pattern because the slope (upward) of the wedge is against the trend (downtrend). When the pattern got completed (support trendline got broken), led to further downside movements.
Continuation Falling Wedge
[Image 9]
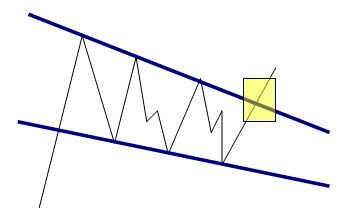
Continuation falling wedges are a bullish continuation pattern. It starts out wide, but narrows as prices keep going down. The highs and the lows of the pattern form a falling wedge. Two or more touched points are required to form the converging trendlines. This pattern is completed when the price breaks through the resistance trendline.
What makes this wedge a continuation pattern?
The slope of the wedge is against the previous trend.
Continuation Falling Wedge in Action
[Chart 6]
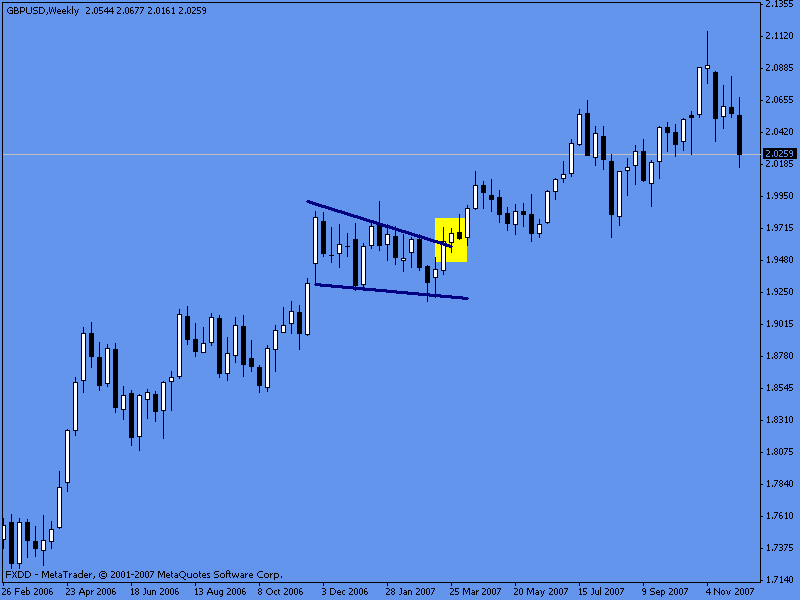
This falling wedge is a continuation pattern because the slope (downward) of the wedge is against the direction of the trend (uptrend). When the market broke the support trendline and the pattern got completed, it led to further gains.
Reversal Rising Wedge
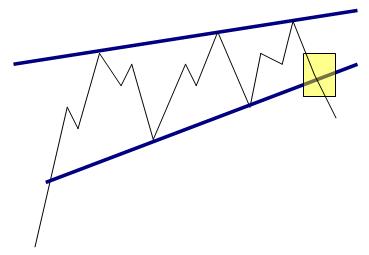
This pattern begins wide and contracts as the market keeps rising:
[Image 7]
Reversal rising wedges are a bearish reversal pattern found at the end of the uptrend. Starts out wide, and narrows as the market reaches new highs forming a rising wedge when two or more points are connected. The pattern is completed when the price breaks the support trendline.
What makes this wedge a reversal pattern?
The slope of the wedge is in direction of the trend. In this case the market was trending up and the slope of the wedge is upward.
Reversal Rising Wedge in Action
[Chart 6]
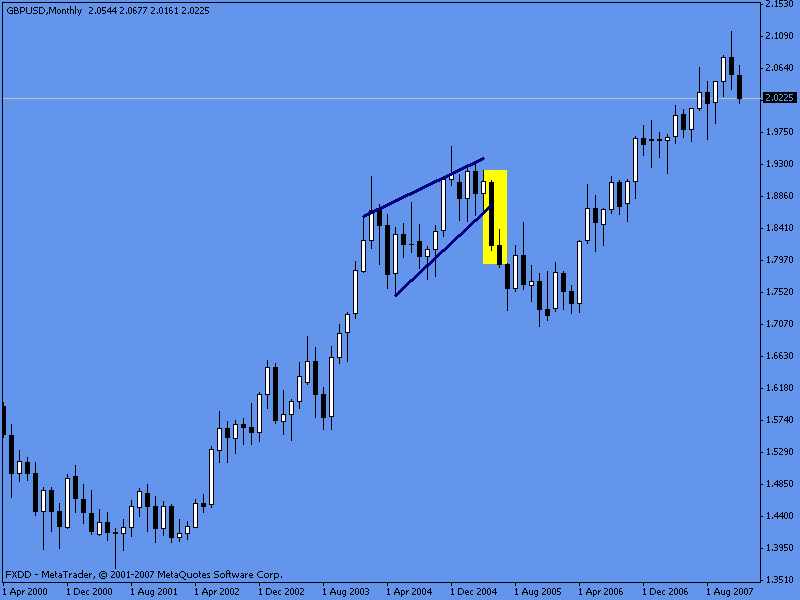
This rising wedge is a reversal pattern because the slope (upward) of the wedge is in the same direction of the trend (uptrend). The pattern is completed when the market breaks the support-trendline. Notice the reversal rising wedge here forecasts a retracement, not a trend reversal. The market movement after a wedge or any reversal pattern could produce: a trend reversal, the beginning of a retracement or a consolidation period.
Reversal Falling Wedge
[Image 7]
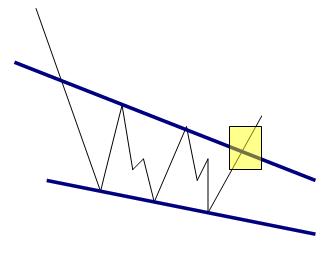
Reversal falling wedges are a bullish reversal pattern. It starts out wide, but narrows as prices keep going down. The highs and the lows of the pattern form a falling wedge. Two or more touched points are required to form the converging trendlines. This pattern is completed when the price breaks through the resistance trendline.
What makes this wedge a reversal pattern?
The slope of the wedge is in direction of the trend. In this case the market was trending up and the slope of the wedge is upward.
Reversal Falling Wedge in Action
[Chart 6]
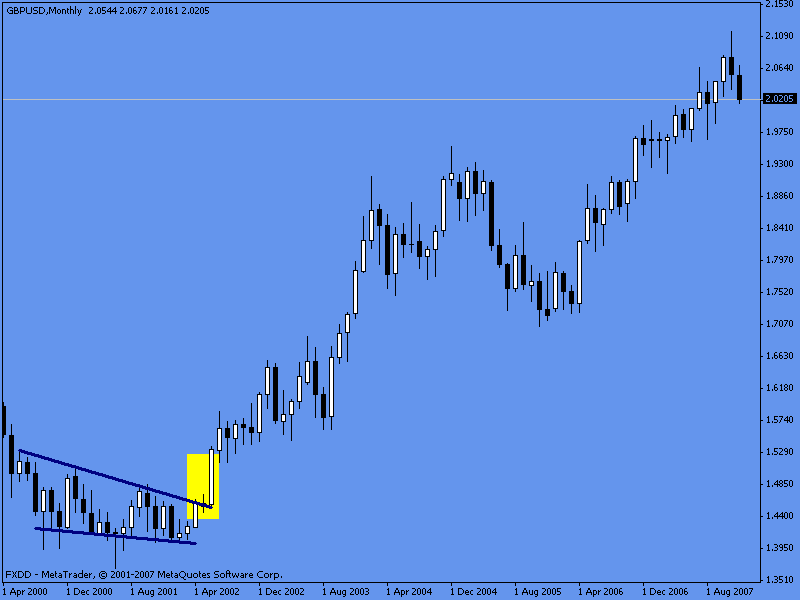
This falling wedge is a reversal pattern because the slope (downward) of the wedge is in the same direction of the trend (downtrend). The pattern is not complete until the market breaks the resistance trendline.
Commonly used target for all wedges
Measure the height of the pattern (in its widest side) in terms of pips, and then subtract/sum the same amount of pips from the eventual break out level.
Brain Feeder 3
What’s the main difference between Wedge patterns and symmetrical triangles?
This one was easy…