Average Directional Index (ADX)
The ADX was developed by Welles Wilder. He created it as an attempt to determine the strength of the current trend (be it up or down).
The ADX reading derives from two other indicators created also by Welles Wilder called Positive Directional Indicator (+DI) and the Negative Directional Indicator (-DI).
The +DI measures the force of the up moves while the –DI measures the force of the down moves.
The ADX does not recognize between an uptrend and a downtrend, it only assess the strength of the current trend. +DI and -DI can be used to determine whether the trend is up or down.
ADX Usage
Usage No. 1 – Strength of the Trend.
The ADX is an oscillator that fluctuates between 1 and 100. When the readings are above 30, the market is considered to be in a strong trend, when the readings are below 20 the market is considered to be sideways, while readings between 20 are 30 are undefined.
ADX to measure the strength of the Trend

[Chart 26]
ADX – Black Line
+DI – Blue Dotted line
-DI – Red Dotted Line
It is said that when the blue line (+DI) is above the red line (-DI) the market is in an uptrend, and when the red line (-DI) is above the blue line (+DI) the market is in an uptrend.
In the chart above, strong trends are marked when the ADX reading go above 30.
Usage No 2 – Determine potential changes in the market trend.
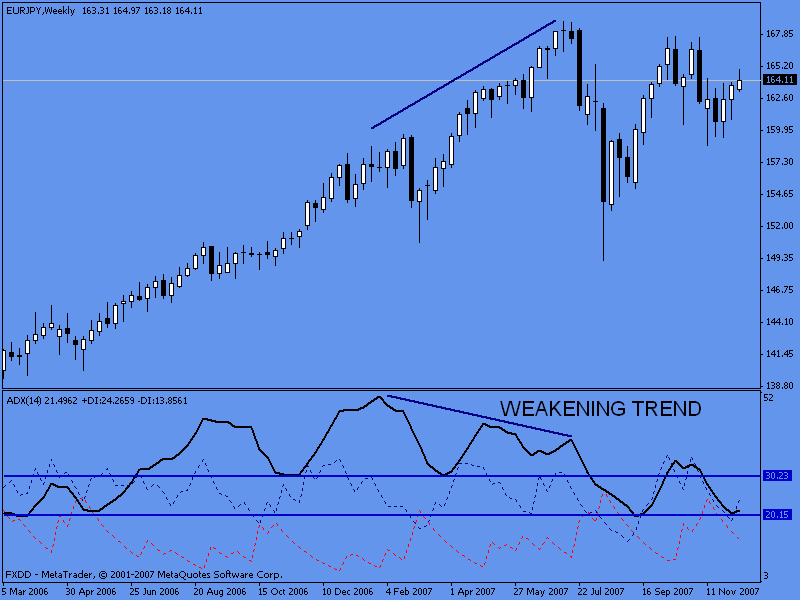
To use this indicator to determine changes in the market trend we need to identify divergences. When the divergence is present near the top indicates the trend is weakening, when it is present near the bottom it indicates the trend is strengthening.
Weakening trend

[Chart 27]
In the chart above, the divergence is present near the top indicating a weakening trend.