Trailing Stops
I am sure you have heard the common saying “never let a winning trade turn into a losing trade”. Getting out of the trade is more important than getting in a trade, at the end your exit will determine whether there is a profit or a loss.
Trailing stops maintain a stop loss order at predetermined values below the market action (or above in the case of short positions). Trailing the stop works best on trending markets, allowing each trade to ride most of the move, closing the position when the trend is more likely to reverse.
There are several ways to trail the stop, among the most important are the following:
Trailing stops based on important levels
This approach might be the most effective of them all. It takes in consideration important levels such as previous high or low, trendlines, support and resistance levels, etc.
Trailing stop based on the last high/low
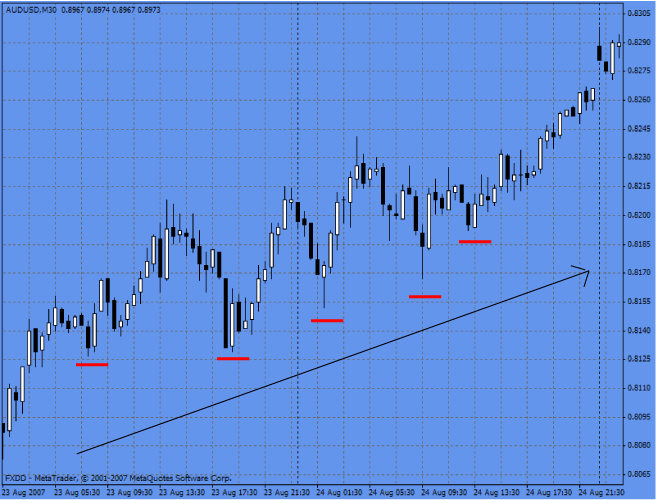
[Chart 1]
As you can see on this chart, when the market trends using trailing stops allows the trade to get most of the move. As the market kept going down, the stop loss order was also moved up (based on prior lows) allowing us to secure some profits. It is important to set the stop loss some pips above/below the previous high/low.
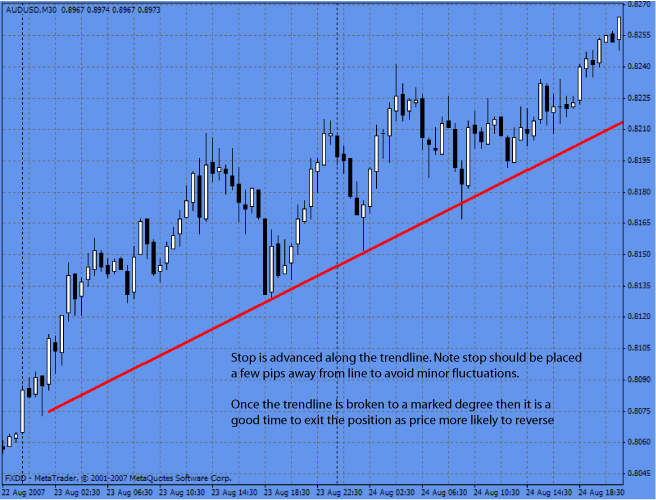
[Chart 2]
Using a trendline to trail the stop is also a good idea. It will keep you in the trade as long as the market continues to trend, and will get you out when a reverse of the trend is possible.
Trailing stops based on technical indicators
The most common indicators used to trail stops are moving averages and Bollinger bands.
Trailing stops based on MA
When using MA to trail the stop we need to be careful on the chosen MA periods. A longer period MA could keep you in the trend for longer periods of time, but at the same time it gives away more profits when the trend reverses.
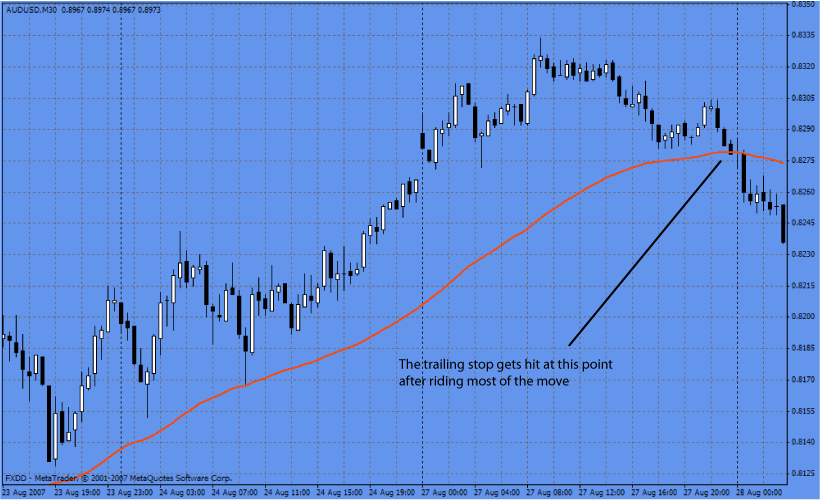
[Chart 3]
A 62 EMA is used to trail the stop in this trade. As you can see, the EMA allows you to ride most of the trend.
A shorter period EMA could get you out of the trade faster giving up fewer profits, but at the same time it could get you out on small corrections missing most of the move.
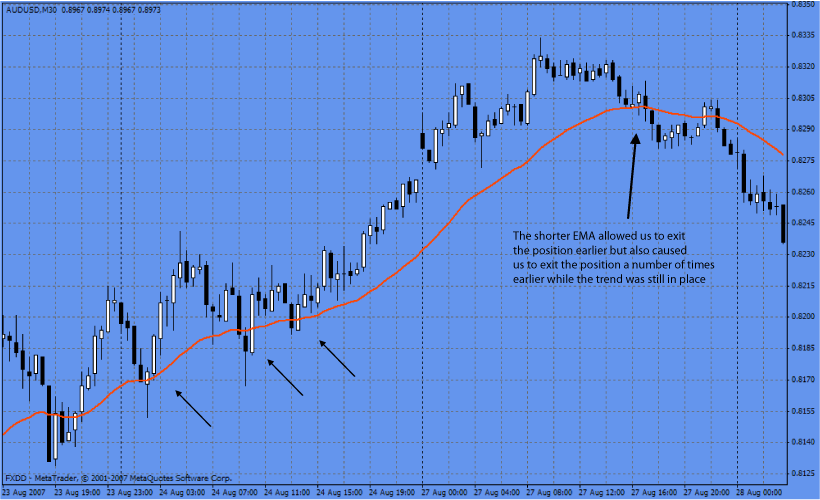
[Chart 4]
On this chart using a 30 EMA you could have been stopped out earlier in the trend. In fact, if we had re-entered the trade the market could have stopped you out again a number of times.
Which MA will produce better results?
There is no hard answer for this question either. It depends on your trading style. We recommend you to try several periods on different timeframes to find the one that fits you better.
Trailing stop based on Bollinger Bands
As seen before, BB is a technical indicator based on volatility. The mechanics to trail the stop based on this indicator are as follow:
In a long trade, use the bottom band to trail the stop.
In a short trade, use the top band to trail the stop.
There is one interesting characteristic about this indicator, 85% of the time the price stays in between both bands. Once it breaks either, there is a high probability of a sharp move. And of course the best thing to do should this happens against us is to get out of the trade.
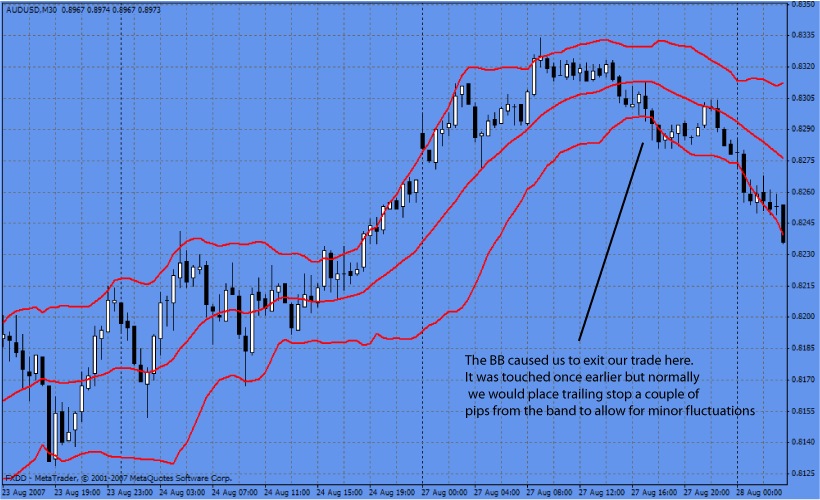
[Chart 5]
As you can see, as the volatility increases the bands expand giving more room to our trade.
Remember BB, as most technical indicators are sensitive to the number of periods chosen. Try different periods to see which one fits better your trading style – this one here was set to a period of 20 and a deviation of 2.
We have outlined a number of ways to place SL orders – it is up to you to decide which one fits your trading style the most – have fun!