Relative Strength Index (RSI)
RSI is an extremely popular oscillator developed by Welles Wilder in 1978. It measures the strength in which the market trends up or down (the ratio of up and down candlesticks for a chosen period of time). The values of the RSI oscillate between 0 and 100. A value close to 100 indicates the market has been trending up sharply, while values close to zero indicate the market has been trending down.
As the RSI approaches to extreme levels, the indicator becomes less sensitive to price fluctuations, making the indicator to go back to neutral levels.
RSI Usage
Usage No 1 – Overbought/oversold conditions.
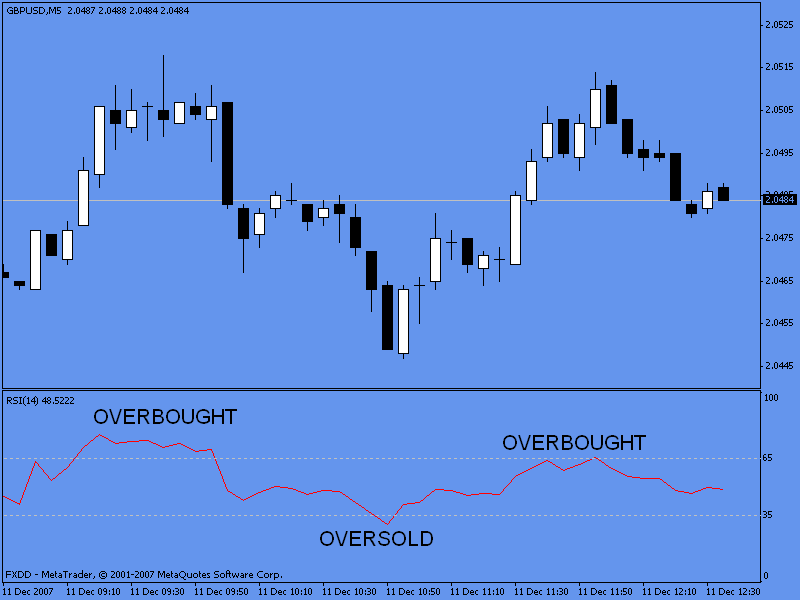
Values above 80 are considered overbought and values below 20 are considered oversold. As the market reaches higher levels, there is a possibility that every bull interested in the instrument has already taken a position (this took the RSI above the 80 level). At this point weak longs start taking profits and closing out positions. This gives the market a chance to retrace, letting the RSI get back to neutral levels, breaking back down the 80 level as the price sells off. The same is true for a downside move, as the RSI reaches the oversold territory (below zero), bears start to take profits, giving the RSI the strength needed to get back to neutral levels, making the price rally.

[Chart 16]
Remember overbought and oversold signals are triggered then the indicators returns to neutral territory from an overbought or oversold condition. These types of signals tend to work better when the market is ranging.
Usage No 2 – Divergence.
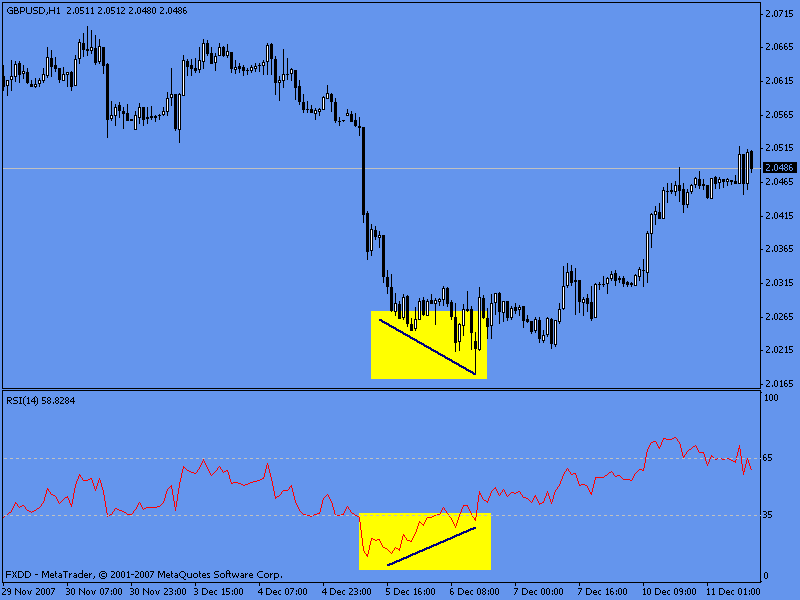
Like other indicators, the RSI is also used for divergence trades but probably the RTI is the best indicator to measure and trade off divergences. When prices reach new levels and the indicator fails to make comparable highs/lows, divergence is present.

[Chart 17]
In this chart we clearly see how the market reaches lower lows while the indicator is unable to replicate those lower lows (it makes higher highs). This indicates that the market isn’t as strong as it was at the beginning. As other trading signals, when the divergence is present it could signal a trend reversal, retracement or a consolidation period.
Usage No 3 – Trend indicator.
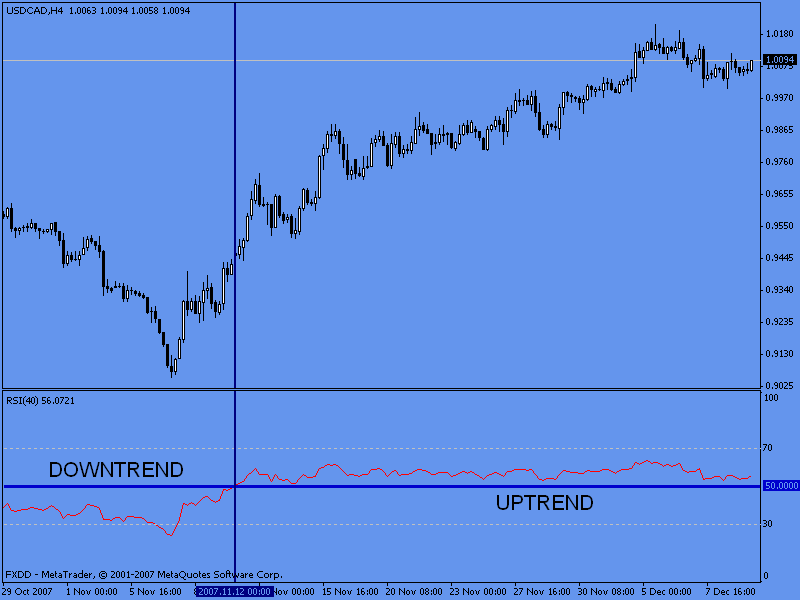
When the values of the RSI are above 50 it indicates that the average gains are greater than the average loses (uptrend). Readings below 50 indicate that the average loses are greater than the average gains (downtrend).

[Chart 18]
The basic rule would be: when the RSI is above 50 the market is to be considered in an uptrend, when the RSI is below 50 the market is considered to be in a downtrend.
It is important to mention that when using the RSI in this way, it is advisable to choose longer periods [i.e. RSI(40) or RSI(80)] .